Plain Docs home page
Search...
⌘K
Ask AI
@plainsupport
Sign in
Sign in
Search...
Navigation
Using Plain
Reporting
Documentation
API Reference
Changelog
Blog
Book a demo
Plain 101
Quickstart
Data model
Security
Channels
Email
Contact forms
Slack
Adding context
Companies
Tenants
Thread fields
Customer cards
Customer groups
Events
Using Plain
Notifications
Assignment
Tiers & SLAs
Priorities
Labels
Linear integration
Syntax highlighting
Reporting
Snippets
Shortcuts
Autoresponders
Plain AI
Using Plain
Reporting
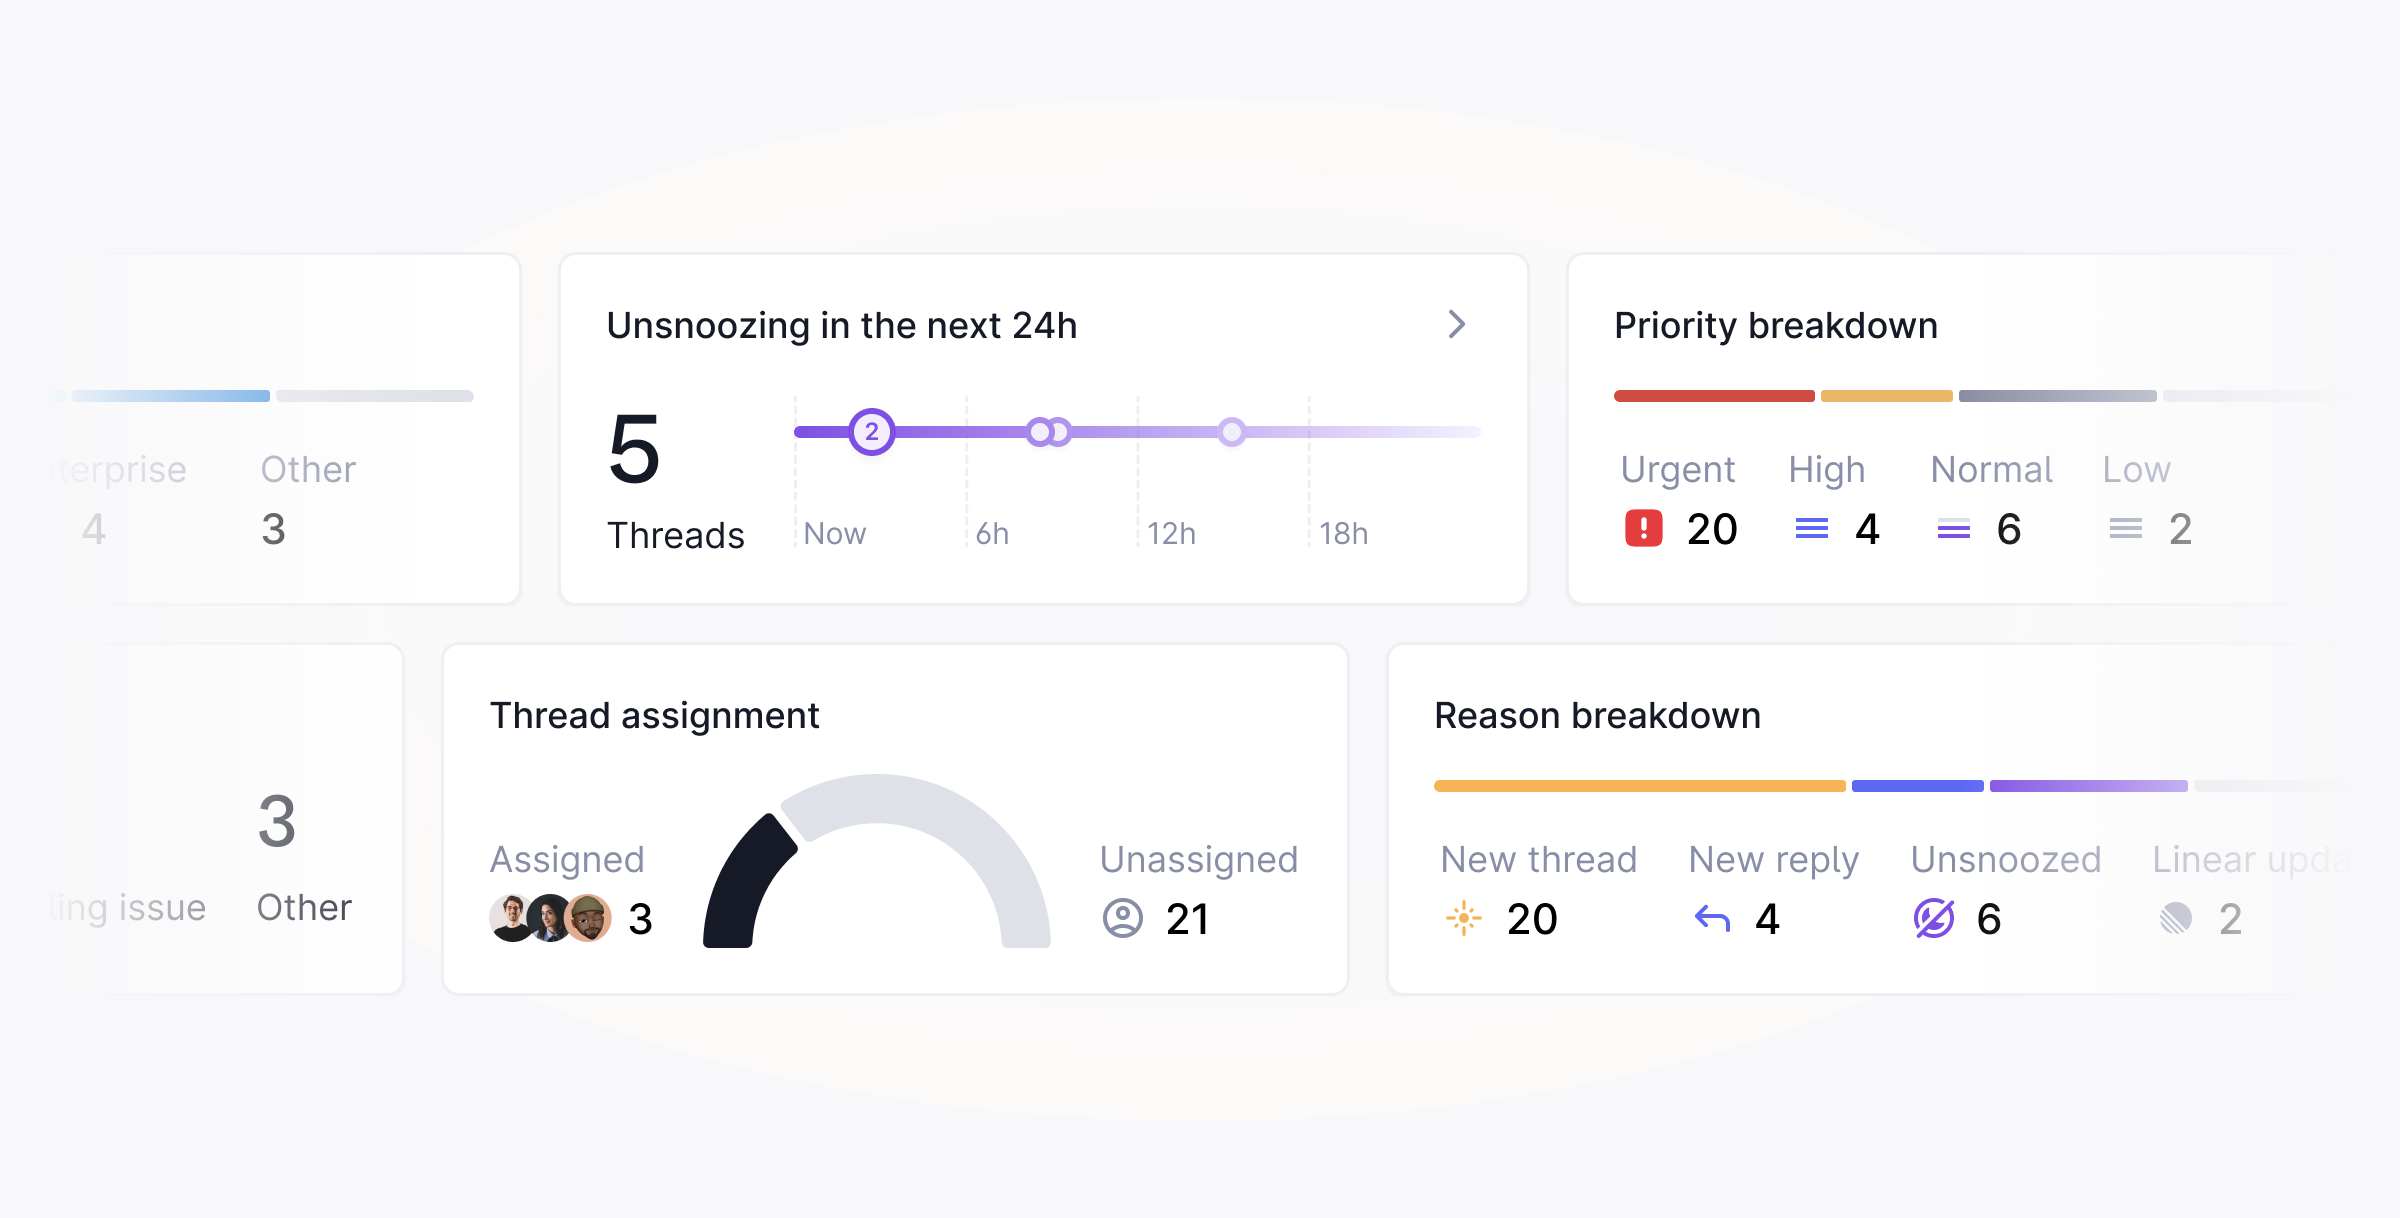
When viewing your threads queue you can at a glance see key metrics on your current support queue.
You can see:
The breakdown of why a thread is in
Todo
(whether it’s new threads, replies, Linear issues, etc.)
Distribution of threads by priority
A preview of how many threads will be unsnoozed in the next 24 hours
Counts of assigned vs. unassigned threads
Breakdown of threads by customer group
Count of threads by label
Was this page helpful?
Yes
No
Suggest edits
Raise issue
Syntax highlighting
Snippets
Assistant
Responses are generated using AI and may contain mistakes.